Data Resources
Understanding GIS Data and Metadata in a Decision-Making Context
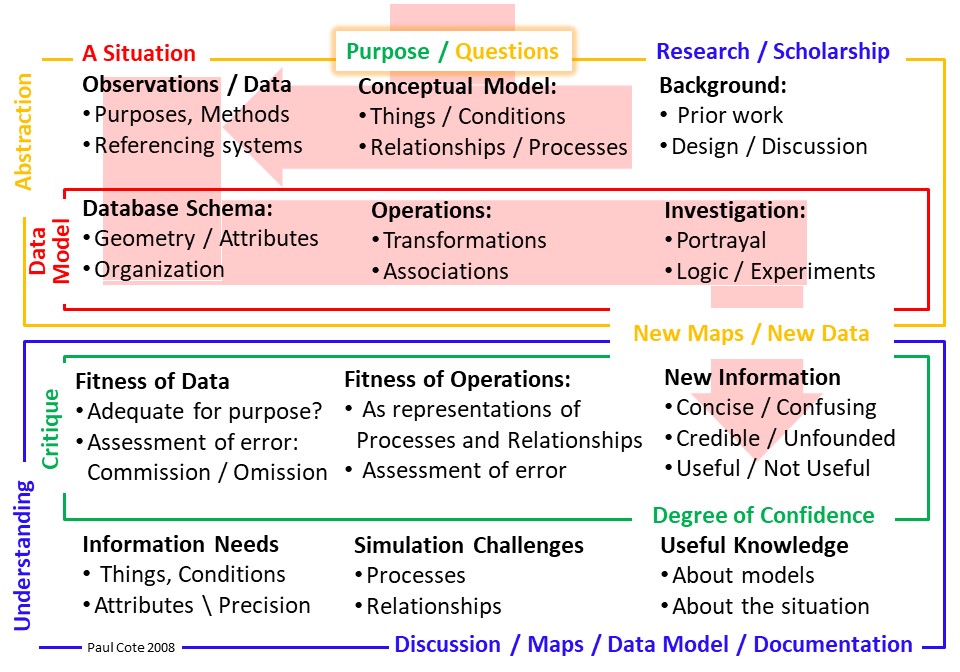
The diagram below is introduced on Understanding GIS Models. As a policy analyst or designer, an important part of your job is to imagine and describe situations in the context of changes. The changes may be imposed form outside, or changes that you are proposing. Data can be useful for formulating well-founded, credible, analysis and recommendations. But data can be confusing. There are many predictasble and common ways that people seem to be naturally confused by data. As ana analyst you need to be able to communicate clearly about what data you are using, and how these data represent critical things or conditions that are of concern. Before re-purposing data, the analyst should have an understanding of the purposes, methods and referencing systems that were employed to create the data. Above all, your writing should demonstrate that you are not unknowingly fallen into one of the instinctively appealing fallacies of data interpretation listed in this document, below.
The information that is necessary for assessing the fitness of a dataset for a specific purpose is known as Metadata.
This page provides some tips for discussing anc citing data and metadata in a credible manner.
Related Documents
- Geographic Models in Decision Making Context
- Sources of Geographic Data Discusses sources and strategies for finding data that can be used in GIS.
- Spatial Data Structures and Formats. discusses and compares the various ways that GIS data are structured and exchanged.
Metadata and Information Infrastructure:
Metadata is important whenever data are intended for serious use. In addition to being essential for understanding an individual dataset, systematically structured metadata is also a key element of data infrastructure such as searchable catalogs of data, or automated systems for mapping and analysis. For this reason there are a couple of important standards for machine-readable metadata. For an interesting point of view on this topic, consider the story of the United States National Spatial Data Infrastructure, which was first chartered in 1990 as a means of coordinating the data collection and maintenance efforts of various federal agencies. The first and largest program of the NSDI was to develop The U.S. Federal Geographic Data Committee (FGDC) Content Standard for Digital Geospatial Metadata. For a demonstration of the power of geospatial information infrastructure, try a search in The Tufts GeoPortal a federated catalog of geographic information resources kept by many authorities across the world. The European Spatial Data Infratructure, INSPIRE is a smilar directive that the states of the European Union establish standards for documenting and sharing data.
Metadata Content
If we wish to use data to represent specific concepts in our conceptual model, there are several aspects of that data that are necessary to evaluate if we are to judge the datasets fitness for our purposes. This information about data is called Metadata. In order to evaluate data, it is very useful to have formal metadata documents.
Metadata will tell you many things that may be necessary for evaluating the fitness of the data for your purposes e.g.:
- What sort of real-world entities is this data set intended to represent?
- What is the Spatial Granularity for entities represented in the dataset?
- What were the methods used to discover and observe and measure these entities?
- Who collected the data? Is the source of data a recognized authority?
- For what purpose were the data collected/intended?
- What time period does the data represent?
- What properties were recorded for the entities in the dataset, and how were these properties encoded in the data? (This is known as the Data Dictionary.)
- Ehat is the Categorical Precision of the important attributes in this table?
- What spatial referencing systems were used to record observations for the geometry of each feature?
- Are the data considered to be complete?
- Are the data logically consistent within the dataset and with regard to other data?
Thoughtful Discussion of Data is an Essential Aspect of Credibility
When you know what to look for, it is fairly easy to spot an analyst that is careful and understands how to describe data. You can see in the choice of words that a person makes, that they are stepping around certain traps that a less careful person is very likely to step into.
The data that you use to represent concepts in your model are never perfect. They are a record of observations that were made at a particular time using a particular methodology for some purpose. The time period of the observations and methodology are critical for understanding whether the data are fit with regard to your investigation and whether they are likely to have omissions, false indications or other logical inconsistencies that will have an impact on the degree of confidence you have in your ability to represent anything useful..
The question as to whether data are accurate or not is meaningless if it is not put into the context of a specific purpose. The important question is whether the data are Accurate Enough for the purpose at hand. If these aspects of data are not discussed, then there is a tacit implication that the data reflect reality. Discussing data this way is instinctive. We all do it, but people who are caeless like this in a professional context are not people wou want to hire if you can avoid it.
Attribution of Data Sources
In addition to discussing the date and methodology used to compile essential datasets, you should also provide citation block on your map. Why?
- You are building on the work of a collaborator, whom it is much better to acknowledge than it would be to have her think that you are taking her work without attribution.
- Other people may be interested in taking your work forward and would want to know how they can update this dataset, or see if the source or the method could be used somewhere else. The citation should include the followint information
- The Title of the Dataset
- The Date reflected that the observations were made
- The agency or individual responsible for creating or maintaining these data.
- If room permits a long citation, include a link or a reference to the location where an updated edition of the dataset may be found.
Short Citation:
When space is limited, as it may be on a map, it may be acceptable to simply cite the data set with its Title, latest update, and responsible authority. Note that the responsible authority is often not the party that has published the data.
Example:
- Protected and Recreational Open Space, January 2015, Executive Office of Energy and Environmental Affairs.
Longer Citation
When more space is available, as in a report, provide a reference that would allow a reader to find the dataset themselves.
Example:
- Protected and Recreational Open Space, January 2015, Executive Office of Energy and Environmental Affairs; published by MassGIS On-Line Link, accessed February 12 2015.
Common Traps and Misunderstandings in Interpreting Data
There are several very common misunderstandings that people fall into when interpreting data. Because most people will naturally fall into these traps, it is important for the analyst to address them where appropriate in the discussion. This consideration serves to help the audience understand how to avoid tempting traps of misunderstanding. Careful language also demonstrates that the analyst is not his/herself a victim of one of these fallacies.
Please: In a concise discussion of data, even though some of these fallacies have names, it is not helpful to use jargon or to simply mention these fallacies in the abstract. Your job is to point out examples of how these issues may come into play with examples involving the specific Things, Conditions and Relationships that have been mentioned in your conceptual discussion.
Absence of Evidence is not Evidence of Absence
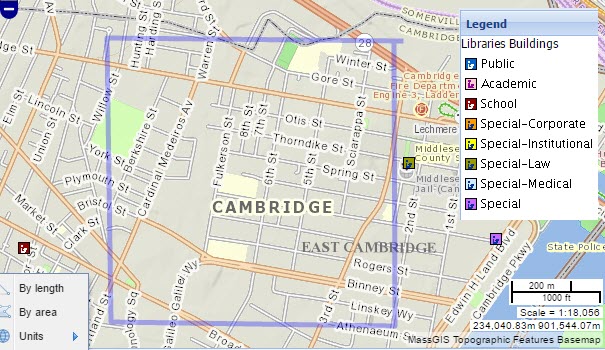
This catchy cliche is a great thing to keep in mind if you want people to see that you are careful. In fact, it actually takes a lot of discipline to avoid blundering into this trap. Consider the map of Libraries, by the Massachussets Board of Library Commissioners, 2005, was accessed from the MassGIS web site in January 2017. For a person interested in exploring consequences of adding or removing a library, in terms of neighborhood library access to children, it is almost irresistable to make an assertion such as: "This map shows no libraries in the 1 kilometer square surrounding the neighborhood of East Cambridge. The trouble with this assertion is that regardless of whether or not it is true, it is completely groundless.
Exploring the metadata a bit farther, one finds this clause (in the metadata as accessed in 2016):
This dataset contains points which represent locations of all libraries currently registered with the Massachusetts Board of Library Commissioners (MBLC). MassGIS created the layer from a list received from the MBLC. The list was current as of October, 2004, and contained the addresses and a few other related attributes for every library that currently meets the MBLC eligibility requirements for registration with the state. Please note that not all libraries in the Commonwealth are compliant with these requirements, and therefore were not included in the list. If a library appears to be missing from the dataset, it is not registered with the MBLC as of October, 2004, and needs to do so to be considered in future updates.
It is rare to find such a detailed a methodlogical explanation for a GIS dataset. It is much more common to simply find a dataset called "Libraries" with no other explanation at all. And it is all too common for people to employ such a dataset to represent the things that it supposedly represents and to discuss it with no qualification at all. This way of reporting "Facts" without understanding them is reckless and irresponsible, and yet most people do this without giving it a second thought. Even people who actually know better. This is an example of a natural trap, that a good analyst must avoid and also ought to warn his or her audience about.
Having the fine metadata that MassGIS has provided with this dataset, one does not have to guess that the criteria for adding a library to this collection may likely omit libraries of special interest in our decision-makng context. Even in the absense of such clear warnings about the biases in the data, the analyst should be very careful that he or she does not make assertions about facts that she has not observed for herself.
Watch Out for Bald Assertions
Making direct assertions about "facts" while you are relying on observations made by someone else is bad form for an analyst. Without knowing anything about the actual circumstances of the data or its fitness, a reader can see that assertions such as these are unfounded merely by looking at the text. Unattributed assertions of this kind demonstrate a lack of appreciation for the work of others, and is a form of plaigiarism. Assertions of this form bring responsibility for errors onto the person who makes them. Worse yet, unfounded assertions will be interpreted as a reflection that the analyst is careless or does not understand what he is talking about -- even if they really do.
Conversely, it is also easy to spot the work of a seasoned analyst or data wrangler who has learned how to step through this minefield. The Analyst's Teflon Shield consists in the employment the following rhetorical devices:
- Always acknowledge your sources, and important parameters of the data in your text. These include the Authority, the time period reflected and issues regarding the categorical and geographical chunkiness of the entities and attributes represented.
- Cite the sources formally in a special attributions block.
- Rather than making "bald" assertions, such as "This map shows that there are no libraries in the area indicated." Say, instead, The 2014 register of Libraries form the Massachusetts Board of Library Commissioners does not show any libraries in this location.
- If you don't know the source or other critical information about the data, say so.
Dressing up your assertions this way may seem overly wordy at first. And in the case of this libraries layer it makes it sound like the analyst is hedgeing. In fact she is and for good reason. However, when you see data being discussed in this careful way, it easy to see that the analyst appreciates her resources.
Appeals to Authority
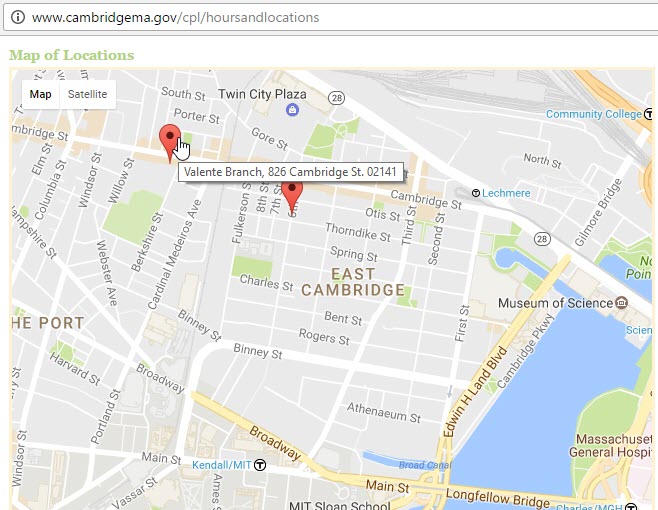
One way of evaluating the probable fitness of a data-set is to consider the authority of the source. It is not hard to come up with a source of library information that is more fit for our purpose -- the web site of the Cambridge Public Library. The map, above, was accessed from the Cambridge Public Libraries Hours and Locations web page on January 26 2017, reflects two public library locations within the same one-kilometer area. Note the careful language in my preceding sentence. In fact I happen to know that the Valente Library on Cambridge Street was torn down a few months ago!
Errors of Omission and Commission, Underestimating, Over-stimating
A very good exercise to go through (and potentially to put into the documentation of your model) will be whether you think that the errors in your dataset will bias your ultimate interpretation and in which direction. Errors of Omission result when a potentially important entity (or a part of an entity) in the real world may have been omitted from the dataset; or Errors of Commission which would result in an entity being reflected in the dataset when, in reality that entity does not actually exist. It is likely that any dataset will have both of these sorts of errors. A part of this would be to understand whether either of these types of error are systematic, which would indicate a Bias in the data. Ultimately, it is very useful if we can predict that whether the model as a whole is likely to under-estimate or over estimate the phenomena in question.
"Accuracy" is Meaningless Without a Clearly Defined Purpose
It goes without saying that a purpose is what makes work worth doing. Without a stated purpose, there is no way to evaluate whether we have achieved anything useful. For example, people often ask whether a dataset is accurate or not. This question is meaningless without some statement of the representation needs inherent in a specific modeling purpose or intention. Understanding the original purpose of the data may provide a meaningful evaluation of whether the data are precise enough for our own purposes. Evaluating a dataset with regard to our own purposes is made possible only if we have made a clear conceptualization of real world things, conditions and spatial mechanismsthat we need to repsent the outset of the analysis. for more information on thuis, see Conceptualization of Models
Spatial Granularity
One of the biggest problems with geographic data and maps is a mismatch between the granularity of the entities represented in the data versus the granularity of the entities that we have identified in our conceptual model. For example, we may be interested in Single-Parent households, but the best information we can find is the count of single-family households within census tracts. IN our area of interest, census tracts may be more one kilometer across. If the relationship that is of concern to us (say, walking sidtance from a household) involves a spatial mechanism (500 meters on sidewalks), then the chunkiness of our data severly limits our ability to explore the question of accessibility.
With this in mind, it is never a good idea to speak about data without discussing the granularity of the representations. For example, Libraries are represented by Points, Census data may be represented at the State, County, Tract, Block Group or Block Level. Soils, Land Cover or land Use may have been discriminated with polygons with a certain specifice minimum mapping unit such as One Acre.
Raster data always has a cell size, but sometimes this may be smaller than the granularity of the original data that a given raster layer was sampled from.
Errors Related to Categorical Precision
It is often the case that a data collection method specifies a certain categorical scheme for recording the condition entities or locations. The MassGIS 1999 Land use classification system is an example of this. Because the classificatrion Urban Open is defined to include parks; cemeteries; public & institutional greenspace; also vacant undeveloped land This datset is next to useless for discriminating between a public park and a densly built-up area (instiutional campus) such as the Longwood Medical Area.
Understanding this, an analyst would simply use a more appropriate datsset, like the MassGIS Protected and Recreational Openspace layer to represent public parks. But be careful! This layer includes many pieces of land that are not parks! Such as hockey rinks and football stadiums. Nevertheless, if one examines the data dictionary in the metadata, one wil see that among the attributes for eachpolygon, the coded values for Prim_Purp may be used to distinquish many important sorts of open space.
Logical Inconsistency
Another important sort of error to look forin data includes errors of logical consistency. An example of this might be if our dataset shows wetlands in an area that our terrain model identifies as Steep, then we know that one of these datasets is likely to be in error. Errors of logical consistency often arise from a difference in geometric precision in one or more layers, or a wholesale displacement of the coordinate referencing systems.
Sometimes logical consistency is more important than other aspects of 'truthfulness' in data. For example, if we are trying to study whether bookshops and laundromats co-locate in areas of higher educational attainment, it may be more important to find datasets that all reflect the same time period, even if they may be five years older than the most current demographic data if we hae no corresponding business data for that period.The room for Improvement
It is helpful to point out these sorts of errors in your own maps before your clients or your critics discover them. The actoof looking for logical inconsitencies, or data that is obviously not-authoritative, is that you will see these issues and look for solutions which can either be incorporated in your project, or if this is not possible,
Parting Thoughts
Speaking about data with proper respect for reality is a difficult habit to cultivate. Just remember this: Maps and models are always about data. Be careful that the subject of your discussion is the entities represented by observations made by a specific authority using a specific methodlolgy in a specific time-frame. Tghis discussion should be in your text - not merely in your bibiligraphy. Discussions that skip over these details lead to an inference that the analyst does not understand what he or she is talking about.
