Spatial Analysis
Creating an Experimental Scheme
This page extends the ideas introduced on the pages, Spatial Models in Decision-Making Situations, and Devising Conceptual Models for Exploration with GIS. Thee backgrounmd pages introcude an idea that Geographic Information Systems may provide a useful set of procedures for representing things, conditions and relationships that may be of interest in decision-making situations. The page, A Simple Back-of The Envelope Simulation describes how you might investigate an impact of accessiibility or exposure related to some change in the arrangement of things and conditions. Our example model simulates the accessibility or exposure that might be related to a facility represented by a point.
This page takes that scenario one step further. Rather than investigating a single facility, we can begin with a feature class representing many facilities. To this we can select particular facilities for removal, and create hypothetical new facilities that might be created at specific locations. THis twist on a simple model allows us to repeat our simple model to investigate the potential impacts of alternative future scenarios that we may be considering.
Tutorial Dataset
This tutorial uses the same tutorial data-set that is linked to the Vectore-Relational Procedures in ArcMap tutorial.
- The Boston dataset is the one featured in the image georeferencing demonstration.
Overview of the Method
Step 1: Create a Feature Class of Existing Facilities
Find a data-set that represents existing facilities. These may be represent5ed as Point Locations -- such as Libraries; or Polygons, such as Public Parks that feature Swimming Pools; or Lines -- e.g. bicycle trails. We wil probably have to use a select-by-attributes query to filter out the specific sort of facilities that are of interest to us. Then you can right-click the original feature layer inthe ArcMap table of contents and choose Data > Export Data to export the selected features to a new shape file to to your project_data folder.
Step 2: Create a New Facility of the appropriate Geometry using the Draw Toolbar
The draw toolbar includes tools for creating Points (markers), Lines, or Polygons. These graphics can then be selected and converted to a new shape file, using the procedures discussed in Converting Graphics to Features. Make sure that the geometry type that you are creating with the draw toolbar matches the type of geometry in your existing facilities table.
Step 3: Use the Merge Tool To Merge your New Features with your Existing Feature Class
The Merge tool, found in the ArcMap Geoprocessing menu, or in the Data Management Tools / General tool-set, allows you to append your new shape file to the shape file that represents the existing conditions. We wil lcall this new feature class, our Schemes Table
Step 5: Derive Alternative Views of your Scheme Table
Most of the associative tools in ArcMap, like Select by Location or Buffer, act upon the selected features in a table. So it is easy to use this single table to simulate Scenario A: for example, existing conditions.; and Scenario B: which has a different mix of features selected, and then use the Buffer or Select By location tool to explore some accessibility or exposure situation to explore a possible consequense of some change or other.
In our data model, different scenarios are created from different (often overlapping) subsets of facility or other locations. Select the existing faciltities to simulate the existing condition. Then repeat your analysis with a different selection to simulate the change situation with new and/or removed facilities! Rather than exporting each sub-set as a new shape-file, it is more It is very convenient to to use SQL queries to create filtered layers that represent different selections from the single scheme table. This can be accomplished using the Definition Query property of a layer; or by a sequence of Select by Attribute and >Saving Selected Records as a New Layer Layers created with either of these methods persist in your ArcMap document, and you can control their symbolization, but they do not create any new data to take up space in your data collection. These layers also inherit and react to changes that you may m,ake in the mother Schem table.
People learning to use geoprocesisng tools and model builder will want to to use the Make Feature Layer tool from the Data Management / Layers and Table Views tool-set. Our tutorial, Vector-Relational Operations in ArcMap describes how these scheme feature-classes can be integrated into easily repeatable models that make these alternative future studies very easy to create, modify and repeat.
Note that you may find it easier to do these selections if you set an attribute value for your new facility or condition so that changes . For example, if your Parks feature class included a Name attribute, you could select your new park and use Calculate Field Values to assign a meaningful name to each of your new parks. This name can also be used tolabel them.Another Lookup Table Demo: Using Business Data and a Standard Industrial Classification Lookup Table
In your studies of neighborhoods and their contexts you may find it useful to look at a very fine-grained representation of commercial activity that has been taken from the ESRI Business analyst. A sample for Cambridge and Somerville is included in the Sources/InfoUSA folder. Use the Add Datab> button to add the feature-classESRI_Business_Analyst_2010Note that the metadata for this layer can be accessed by right-clicking the table in the table of contents and choosing the Data > View Item Description option. The metadata for these layers is lacking in explanation for the methodology used to collect the data on entities and their locations and other attributes. This lack of documentation makes it very difficult to talk precisely about what these data mean and what they are useful for. Nevertheless they are very interesting data to look at, and can be useful to experiment with hypothetical data models.
Take a look at the attributes table for the businesses table. These business records are very diverse. The types of businesses are distinguished by a couple of classification schemes, NAICS and SIC. The Wikipedia page on SIC codes has a listing of 4-digit SIC codes, and a list of helpful resouces at the bottom of the page. Several years ago, I found a nice SIC lookup table for the six digit SIC code and did a little data-wrangling in Microsoft Excel. I then opened the table in ArcMap and exported it to a DBF (dbase format file). We can now use the lookup table techniques discussed in part 1 of this tutorial to explore and re-categorize our shapefile of business points. You can add the lookup table from info_usa/sic_lut_pbc.dbf.
A Hierarchal Category System
Many categorical referencing systems employ a hierarchal coding system. If you add the SIC lookup table from the Sources/Info_USA folder, and open it in ArcMap, you will see columns that relate to three levels of genealization for SIC is represents the original code as a number, which is what happens when you import the codes form a CSV table. Even though al of the characters in the SIC are numerals, they are not numbers. That is, these references are not intended to work with the logic of arithmetic. There is a very important logic to them, however; which we can put to use using combinations of selections and field calculations the string operators in our SQL tool kit, some of which are described below.
The Fields of the SIC Lookup Table
Many hierarchal codes, including SIC, use strings of characters (usually numerals) which may be parsed according to the order of the characters, for example, sic_6_txt is the six digit code as a character string with the leading zeros added back. These codes are related to the Six-digit SIC description, SIC_6_Desc in our lookup table. Taka a look at how detailed these categories are!.
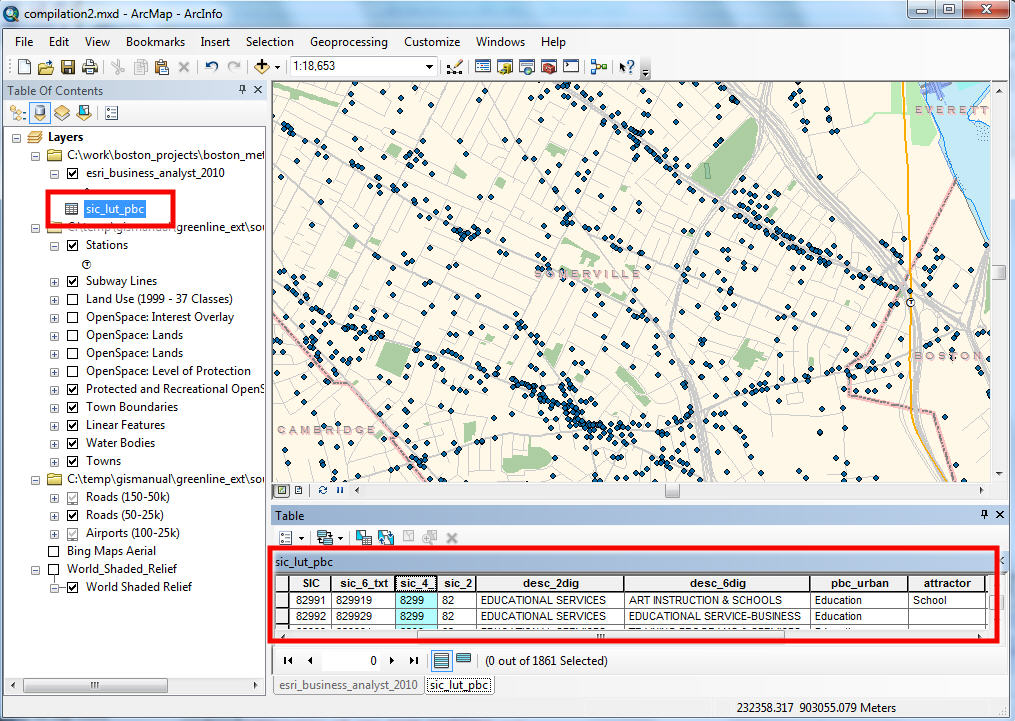
Now look at sic_4_Txt and sic_2_txt and their corresponding description fields. Note how the two-digit descriptions represent very general categories, and the four and six-digit descriptions that share the first two digits are all children of the category described by their sic_2_desc. Hierarchal coding schemes lend themselves very well to creating lookup tables. As you can see how I have created the pbc_urban classification system by ordering and manually selecting broad categories that were of interest for mapping urban businesses. pbc_amentiy and Attractor reclassify businesses from the perspective of understanding which ones might attract walk-up and vehicular visitors.
Character String Operators and Queries
With references encoded as character strings it can be useful to formulate selection queries based on pattern-matching wild-card patterns, such as "Select all rows where the SIC Description includes the string "DOG" or "PET". This can be accompished using Wild-Card pattern matching queries. See screenshot. For many examples of wild-card searches, see Building a Query Expression. This handy reference is also available from the Help button at the bottom of the Select-By-Attributes dialog. Not that the distinction between double-quotes and single quotes is important.
The selection of rows form the look-up table, above reveals that dog and pet related businesses that we may be interested in, have the SIC Codes, "599929"or "599930" or having "0752" in the first four characters. With this information, we can select the points representing the locations of businesses related to Dogs and other Pets with a query agaiunst the ESRI Business Analyst table. See Screenshot.
