History of Geographic Technology
Topography: Representing Place in True Proportion
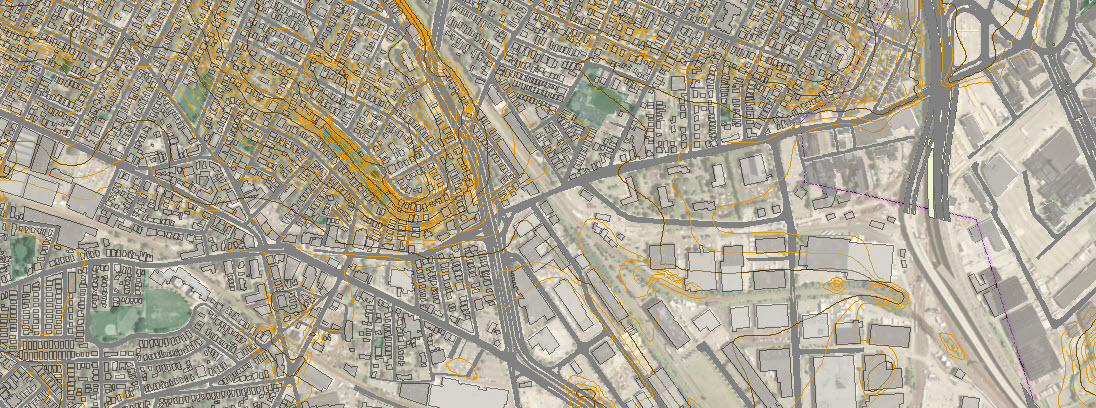
This page is used to introduce digital elevation models and orthophotographs. Digital elevation data allows us to add information about landform to our maps using contours or synthetic hill shading. Digital elevation data also permits us to model important processes, including calculating how water and sunlight or anything else moves across the landscape.
Terrain is such a critical factor in virtual any landscape study that it is important to understand how the data are created. This is especially true, since people who go on to evaluate or contract for the creation of geographic data need to have some idea of how it is created. As it happens, looking into the history of topography provides a way of understanding elevation data but also orthophotographs and highly detailed planimetric data about the precise locations of buildings and parking meters, edge of pavement, etc.
Topographic Maps and Planimetric Scale
Topography is a term that many people take to mean Related to Terrain. Topography has a broader meaning related to it's Greek root, which may be translated as Describing or portraying a Place. The confusion in the use of the word topography because topographic maps maps portray the elements and relationships inherent in places, and these maps often employ contours to represent landform.
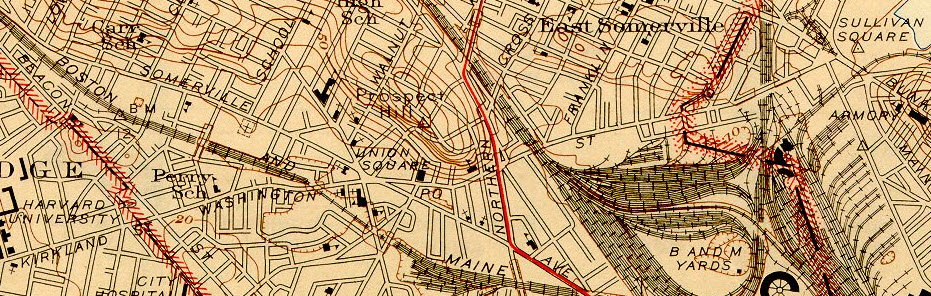
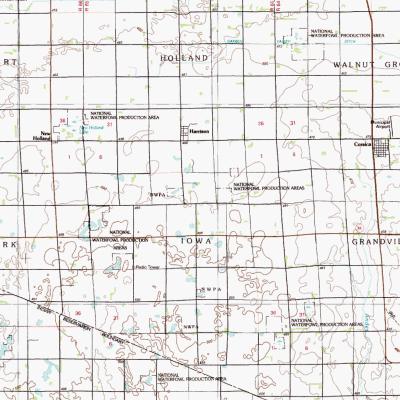
The map excerpt above is form the USGS 7.5 Minute Topographic Quadrangle, Boston North (1946.) The map shows many topographical relationships, such as: There is a large rail yard named B&M Yards to the East of Union Square. We can also see that there is a hill, Prospect Hill, to the North of Union Square. Because the bottom of the map (not shown) has a scale bar and identifies the contour interval of the map, we can use this map as a reliable record of the distance across the rail yard and the height of the hill as they were observed by a topographic team. Yes, topography is also a verb that describes the activity of a type of a professional known as Topographers.
To be useful as a tool for representing the true (enough) relationships among the elements of a place, including distances and directions, topographic maps are assumed to have Planimetric Scale that is scale that is consistent regardless of what direction or in what part of the map you are measuring. This means that topographic maps are typically large-scale maps -- which means that they cover a relatively small area.
Plane Surveying
Almost everyone eventually comes around to asking How are maps actually made? How were people able to make very precise topographical maps before they were able to fly around in airplanes? The answer boils down to understanding relationships between triangles. IN fact, the same sorts of triangulation principles that people developed for making small scale topographic maps also are used for turning areial photos into topographic maps and elevation models.
In practice it helps if you can disregard the fact that the earth is not flat. As a matter of fact, as long as your map does not cover an area larger than 100 square miles, as stated by John Tracy, in his wonderful Plane Surveying, A Text Book and Pocket Manual , published in 1913 by John Wiley and Sons:
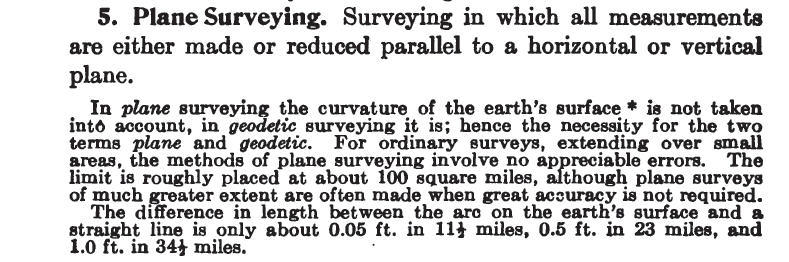
The fact that the planet is so large that we can measure to within almost 1/20th of an inch using plane geometry as opposed to having to use spherical trigonometry allows us to use very simple relationships between similar triangles to do some amazing things with maps.
these days, the instruments and techniques for creating topographic maps involve a lot of electronics and automated processing. But all of the essential principles are based on plane surveying and very down-to-earth properties of triangles. After we look at these essentials, we will be ready to talk about how maps based on plan surveying assumptions are corrected to fit our roughly ellipsoidal earth models.
Plane Table Mapping
The Plane Table and Alidade is one of the most elegant illustration of the way that triangulation from multiple positions can be used to quickly create topographic maps. The following images provide some illustrations of how plane table mapping works. Click the images for an enlarged view.
 |
 |
 |
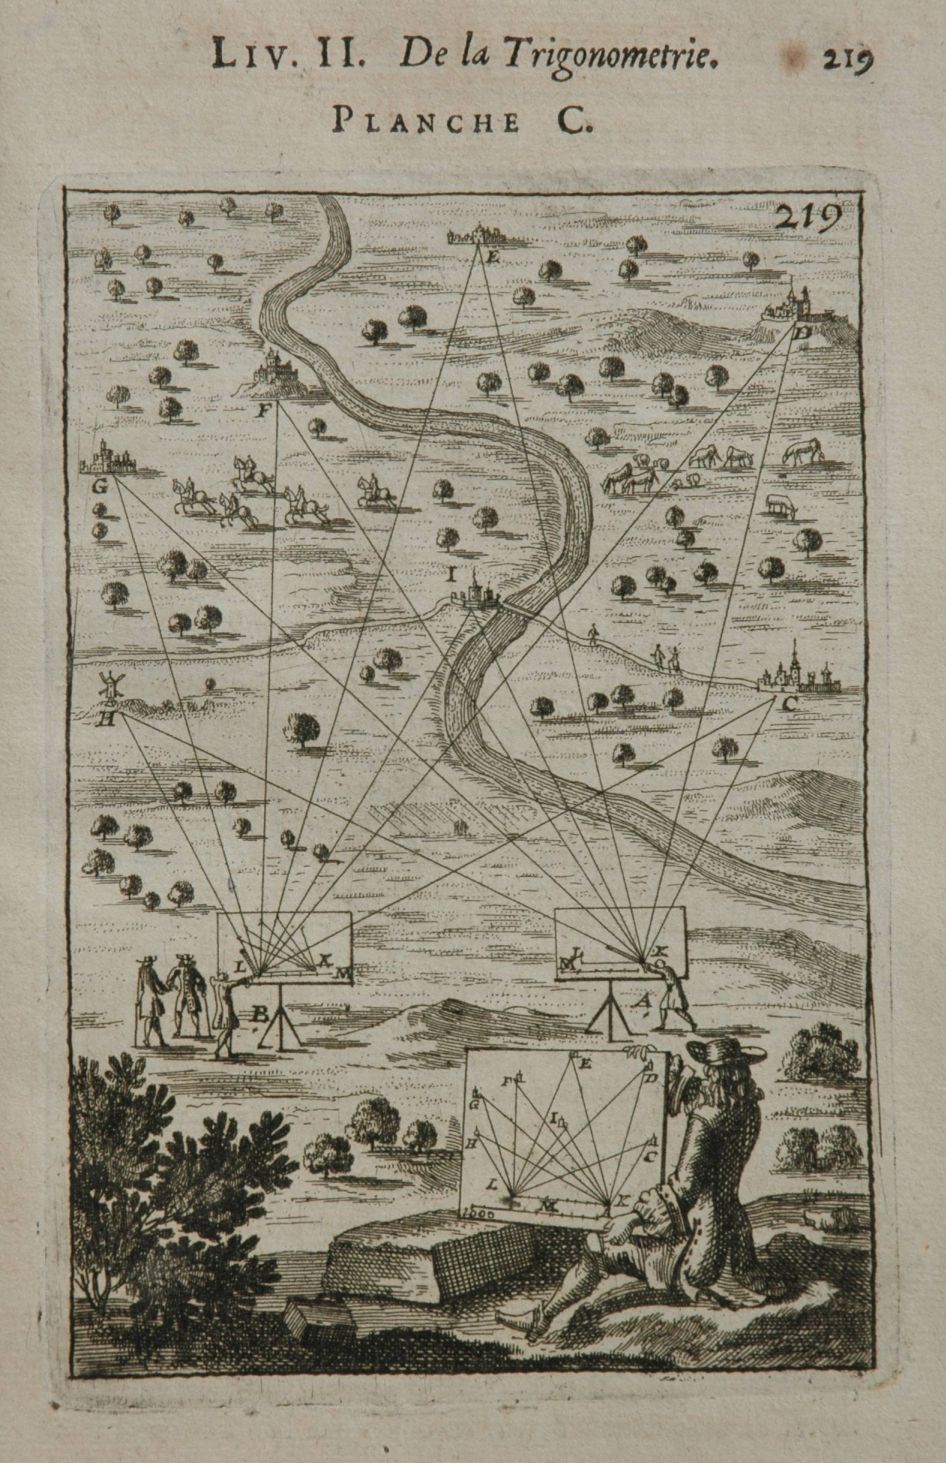
The cherubs in the image to the left were drawn in the margin of Giambattista Nolli's Map of Rome; 1748. The other two images are from Allain Manesson Mallet: La Geometrie Pratique, Published in 1702.
The middle image shows how a plane table can be used to trace the directions to landmarks while set up may be set up at position A. Rays the directions are drawn on the plane table using an Alidade, which is a straight-edge with a pair of sights on it. Then the table is moved to position B. Point B is one of the points that was observed from positioon A. The board is oriented by aligning board doriented by laying the alidade along the line between A and B, and then turning the board until tha alidade points at positon A. Now, when you draw the rays from positon B to all of the landmarks, their planimetric position emerges on the sheet. This map wil allow you to estimate the diostances between all of the points and the only distance you need to measuer is that between points A and B!! If this description was difficult to follow, you may prefer this exposition of the basics of planetable mapping from the Scouts of South Africa.
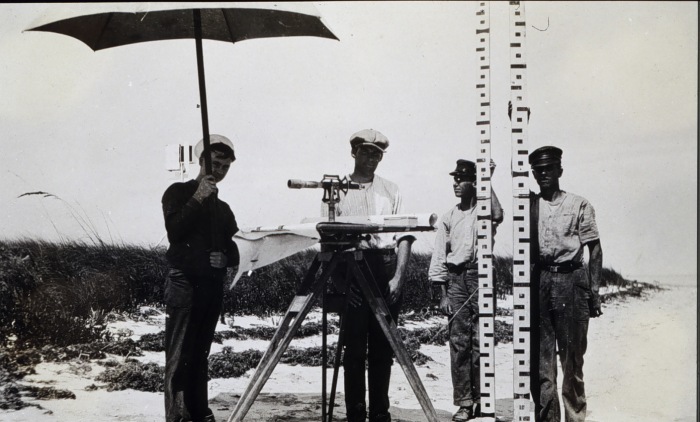
There is not a lot of high-technology in the basic plane table and alidade. But until aerial photography and automated photogrammetry became practical (the 1940s or so) plane table mapping was how most topographic maps were made. And that includes map series covering entire countries. Many innovations were introduced into plane table alidades over the years. most importantly the introduction of telescopes with calibrated focal properties that permit the measurement of distance and relative elevation with one observation. This one shot positioning is accomplished with a combination of Stadia measurement or Tacheometry , which gives you a good estimate of the slope distace, whicn than can be reduced to the horizontal (planimetric) distance according to the tilt of the telescope.
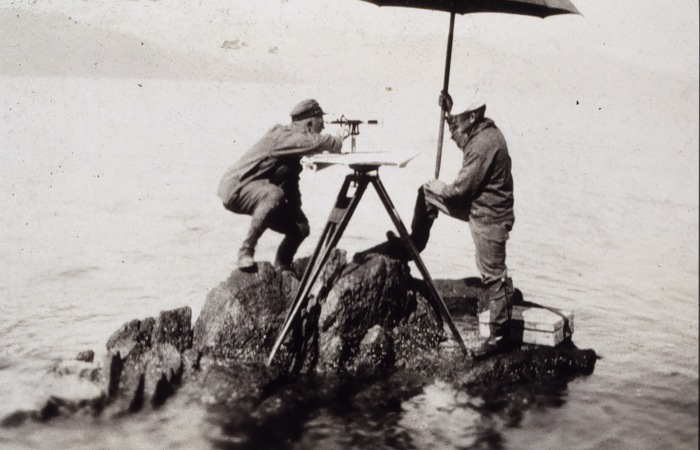
If you are interested in this sort of thing, you should check out the collection of historic images frm the Coast and Geodetic Survey of the United States, which has been put together by today's National Oceanographic and Atmospheric Administration.
 |
 |
 |
It is truly amazing how much territory was personally observed by topographic parties making observations with plane table alidades!!
Adjusting Plane Surveys with Geodetic Control
Plane surveying is fun, and it is still the way that precise property and engineering surveys are carried out within certain limits. But you have noticed that the data that we use in web mapping tools and GIS seems to seamlessly cover the entire globe. The map on the left shows what can happen when people have laid out roads assuming the flat earth, and then have to face the consequences when two road-making efforts have to be fit together on the round earth!! To make planimetric data fit together over long distances, small corrections have to be made that fit the map to geodetic control networks that represent key locations on the ground in terms of latitude and longitude.
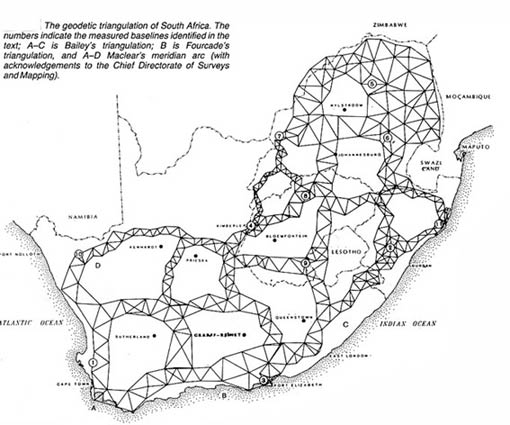
To facilitate the creation of accurate maps that cover very large areas, national mapping agencies have created Geodetic Control Networks The precise latitude and longitude for first order points by making observations on stars and taking into account our very precise understanding of how quickly the planet is turning on its axis. To make a long story short, the local meridian under your feet may be be staked out on the ground by observing the direction of the pole star. The latitude of your position can be observed by measuring the angle between the pole star and the horizon. The Longitude of your position can be ascertained by observing the time at which specific stars cross your local meridian. The sun, for example crosses your meridian at Local Noon. If you know what time it is in Greenwich, England, your latitude can be computed as local time minus Greenwich time (in seconds) divided by 240.
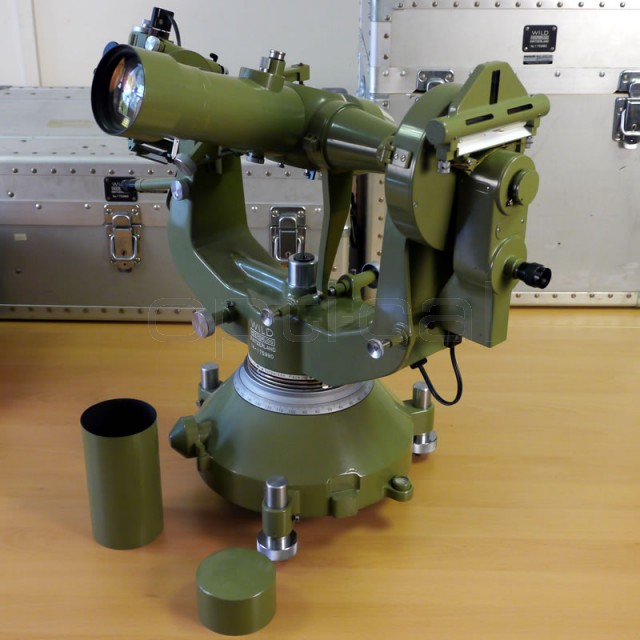
These measurements can be made with great precision with fairly simple instruments, such as the Wild t-4 theodolite shown on the right, which according to its specification can measure vertical angles to 2 seconds and horizontal angles to 0.1 seconds of arc. According to my crude calculations, this instrument would be able to ascertain the locationon the planet with a precision of less than one centimeter. Making observations and geo-positioning to this order is complicated and requires factoring in many corrections including an estimate of your distance from the center of the planet which would be given by some sort of earth model assumptions.

Points in a geodetic control network are actually marked on the ground with permanent monuments like the one shown on the right. Surveyors can tie these official location benchmarks into their surveys. Back in the surveying shop, the latitudes and longitudes of the control network are projected into a local coordinate system, and the resulting control points are used to make slight corrections to the geometry of the locations that were established using plane geometry. The resulting maps may be reprojected tiled together with other surveys.
Photogrammetry: Measurements from Photographs
As you have already guessed, our modern GIS data is no longer created by parties of topographers making observations from the ground. Most local GIS data comes form aerial photography that is processed to remove the distortion that is inherent in photographs. This process is known as photogrammetry which stands for the science of taking measurements form photographs. Like plane table mapping, the process of making maps from aerial photos begins by making observations from two locations with a known distance between the observation points. Most aspects of the photogrammetry workflow have been turned over to computer processes. Nevertheless, the easiest way to understand how this works is to look at how human beings used to do this with optical and mechanical devices.
Aerial Photographs are not Planimetric
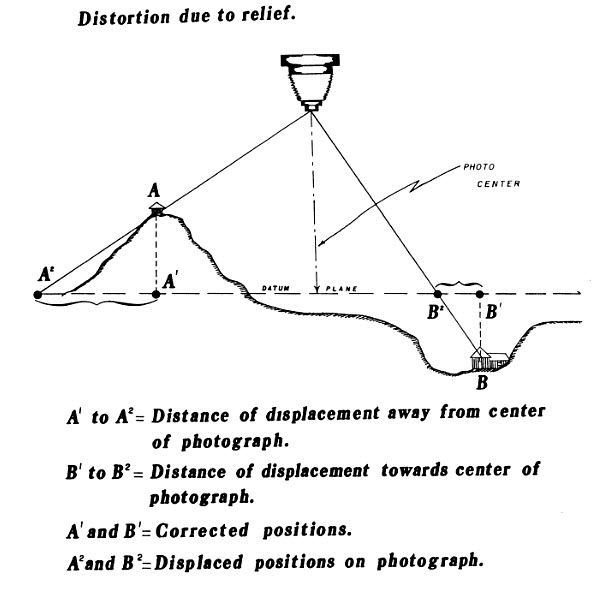
Because photographs are taken through a lense, the resulting image has perspective. Perspective results in the apparent displacement of geometry. Click on the images below to see an enlarged view.
 |
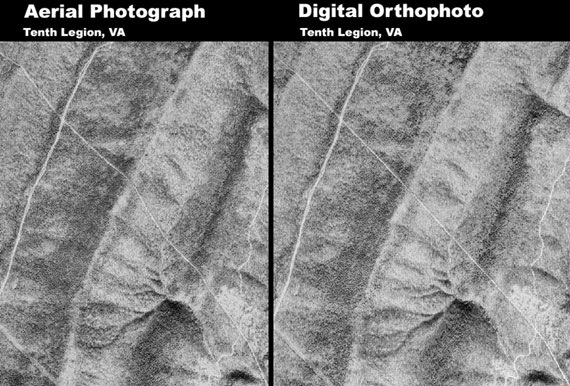 |
The first image is from Interpretation of Aerial Photographs published by the US Department of Agriculture in 1983. The second image is fromo the US Geological Survey's web page about digital orthophotos. Notice that the road in the Areal photograph appears curved where it crosses the valley; while on the orthophoto it looks straight.
Stereo Photogrammetry
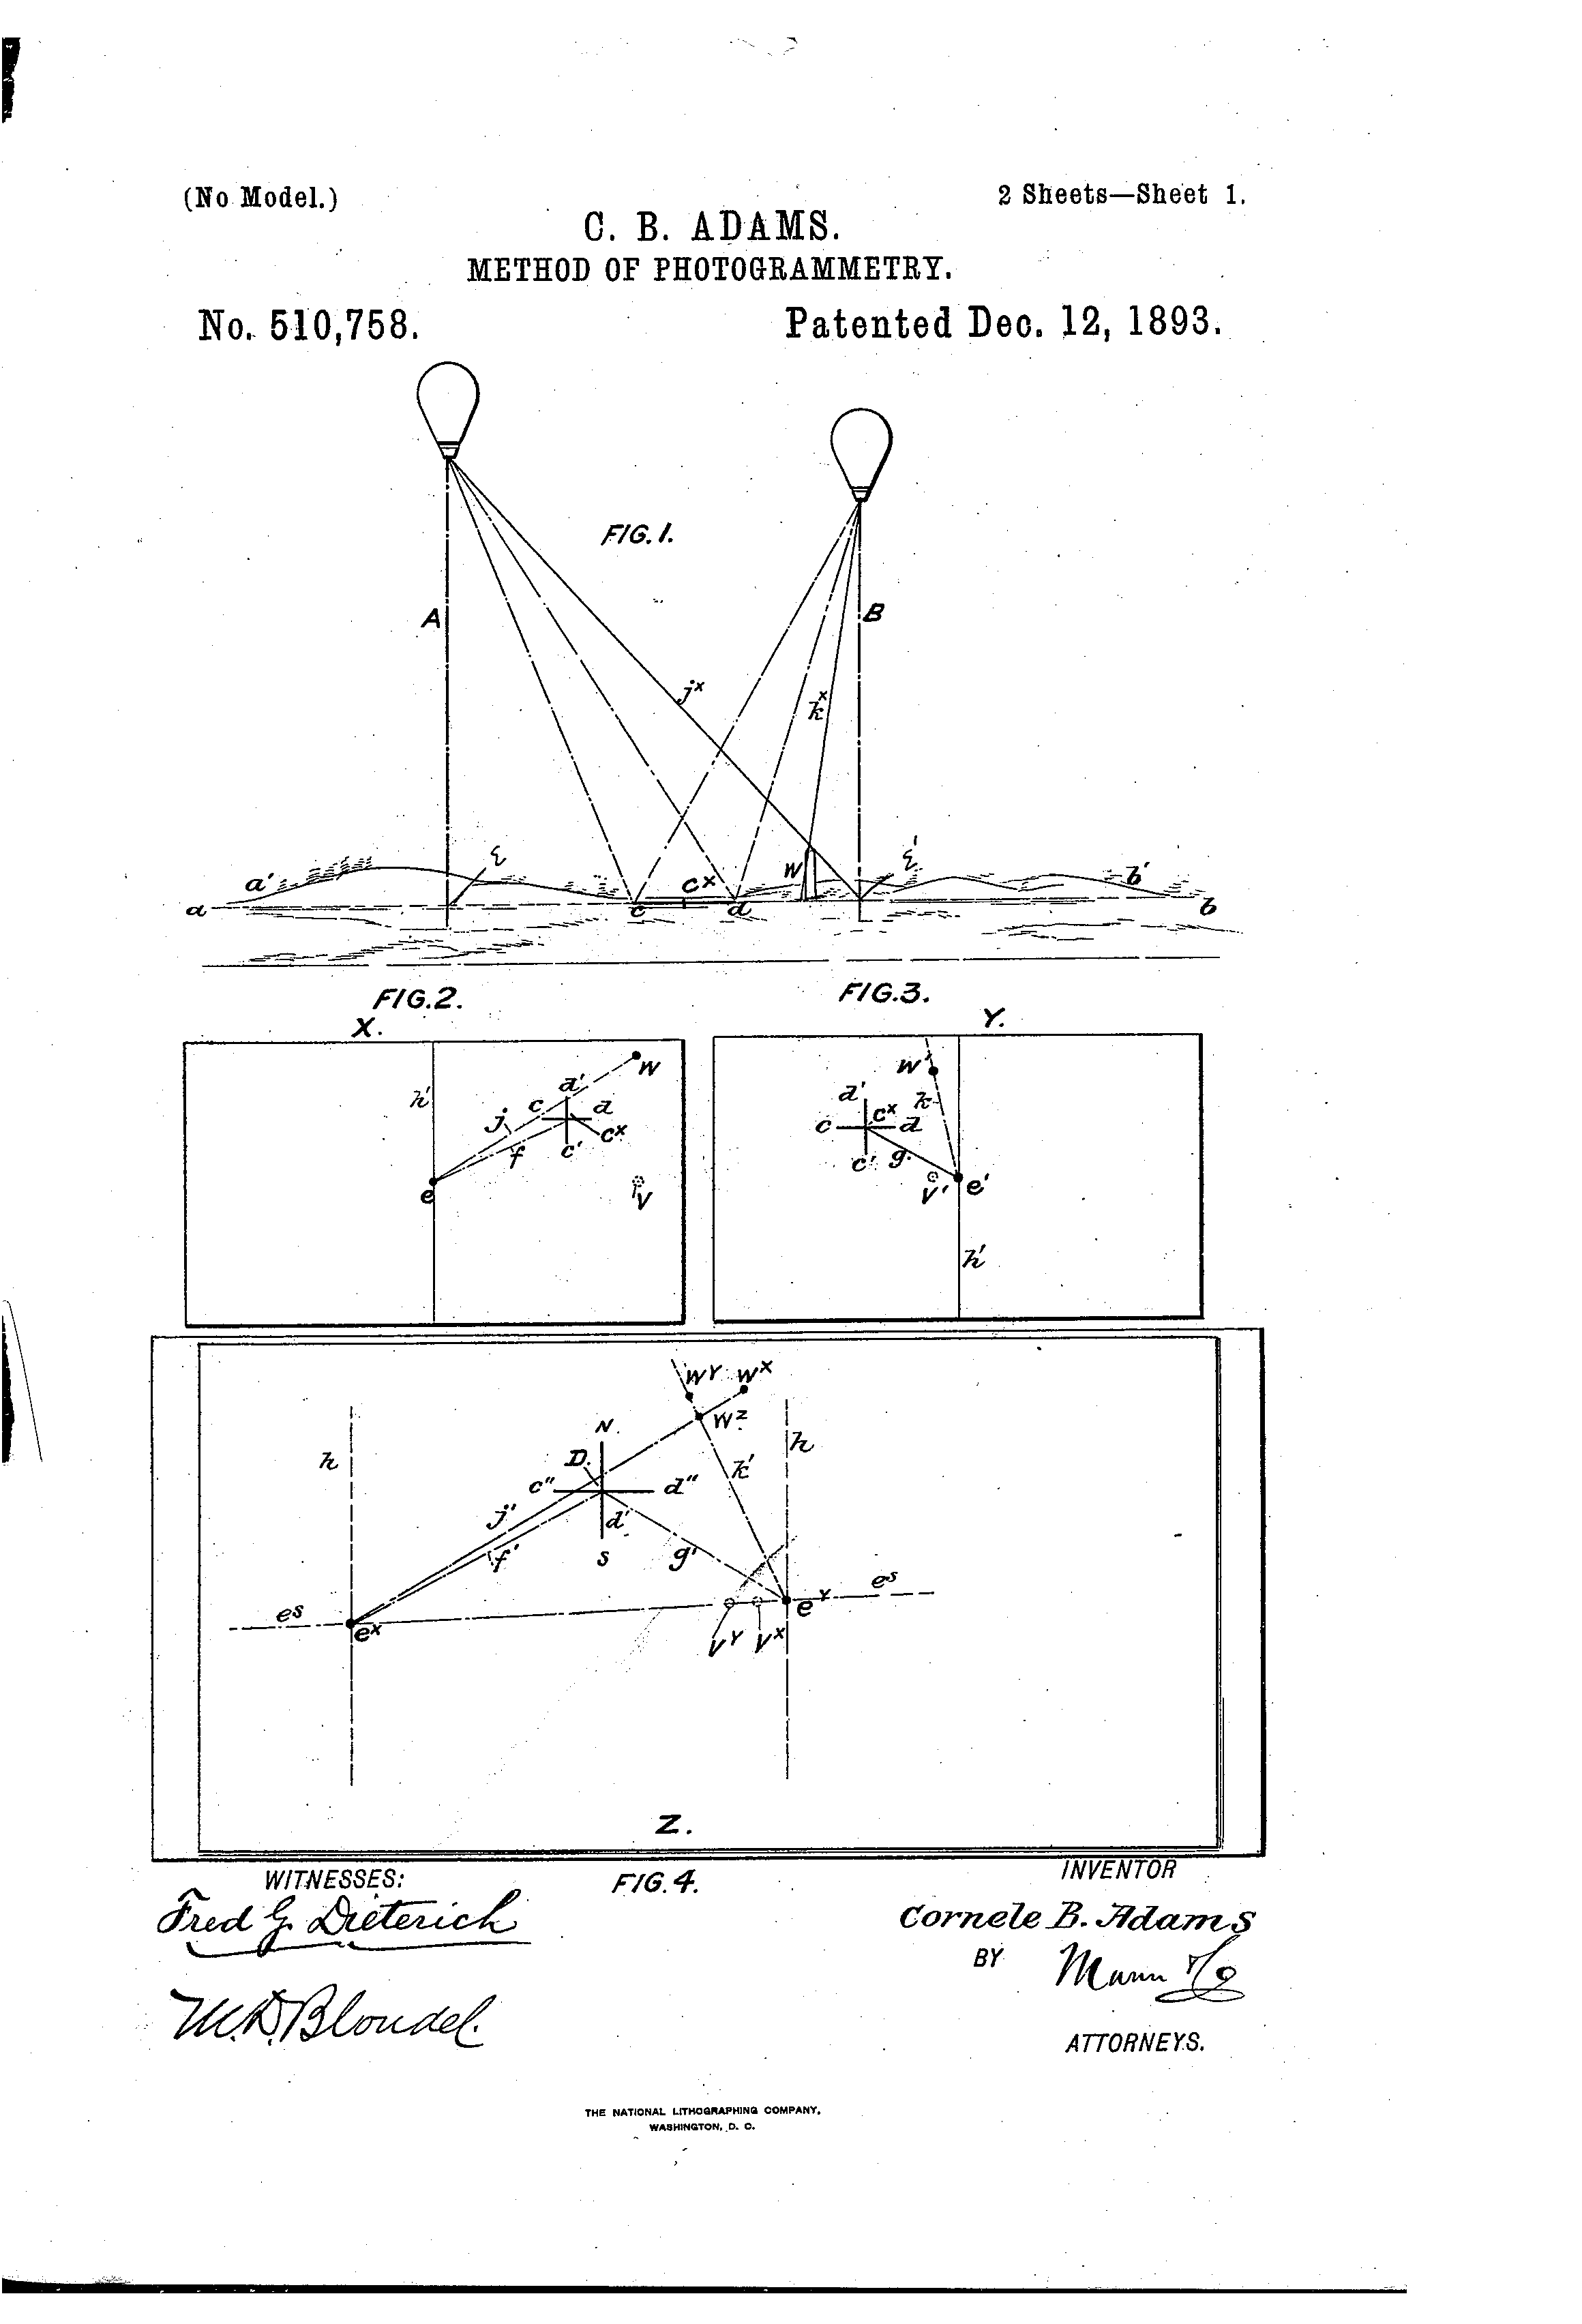
While one might consider the displacement of imagery that occurs in perspective photos, this displacement is actually a useful form of measurement. It seems that one of the first people to notice this, or at least to patent the idea, was Cornele Adams, who filed a Patent for a Method of Photogrammetry in 1893. Click the images below for an enlarged view.
 |
 |
 |
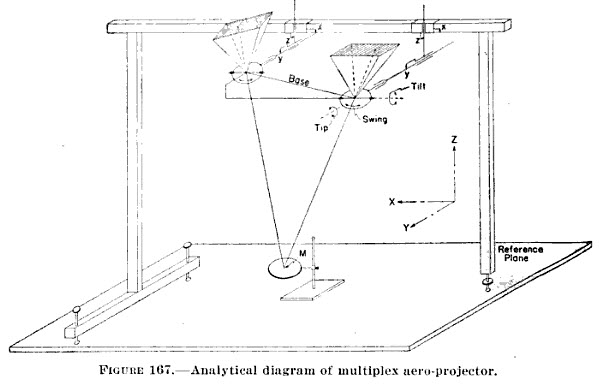
The image on the left is from Adam's patent on a method for photogrammetry. You can read the patent to see how measurments made from the photographs taken form two known positions in the air can be used to solve equations that return not only the planimetric distances between objects but also their elevations. Around that same time Carl Pulfrich and Eduard von Orel developed the concepts and machinery for registering aerial photographs in a stereo projector such that a draftsman would be able to trace lines onto a virtual 3D model that is projected onto a movable palette. The conceptual diagram of a stero projecter like the one they concieved is shown in the middle image, from Topographic Drafting, Techncal Manual 5-230, U.S. War Department, 1940 (See A history of Photogrammetry from the Center for Photogrammetric Training for more details. From the early 1900s through the 1980s, machines like the Wild Stereo Autograph pictured on the left were the workhorses of topographic mapping. These are extremely elaborate machines combine optics and mechanical linkages that allow the photos to be adjusted to create the 3d Image. While the operator moves the palette, the machine on the right actually draws contours or other features. No computers involved!!!
As microcmputers became more useful many of the processes of photogrammetry became less reliant on analog hardware. But even today, human operators are necessary in order to distinquish the features that ought to be mapped. Kent Brown of the U.S. Geological Survey has shered a very nice overview of more modern photogrammetric tools and procedures.
Digital Orthophotos, Planimetric Data and Elevation Models
Although the principals of photogrammetry employed to create today's topographic maps are more or less the same as identical to what Cornele Adams described in 1893, the techniques and the products are now digital. Photographs may be captured with digital cameras with all of the metadata about their location and tilt, etc that is required for a computer to create the virtual 3d model. An operator identifies important points on the ground that will be used to create a terrain model that excludes buildings and trees, etc. The computer may help to trace linear features like building footprints and roads. The end result od this modern photogrammetric procedure includes:
- A planimetrically corrected photograph, known as an orthophotograph.
- A terrain model.
- Planimetric vector representations of building footprints, edge of pavement, and fixtures such as street lights, sewer catchments, etc.